So that mean old boss of mine is at it again. This morning I came in beaming about how many people had read my post How Much of R is Written in R (thanks by the way!). He then asks me about one little line in that post; the one about how if you looked at the contributed packages, you’d overwhelmingly see them written in R, and that this is what really matters.
He asked if I had bothered to verify this. I had not. So off he sent me to do this too. Can you believe the nerve of this character? Making me do work. I’m paid by a university; I’m not supposed to do work!
So think of this post as the quick cash-in sequel that no one probably wanted–the “Transformers 2” of R-bloggers posts, if you will. I don’t mind admitting that I had to use every ounce of constraint to not call this “… Part 2: Electric Boogaloo”.
This task is a little more cumbersome than the last one. Unfortunately this means I have to actually be slightly careful in my shellscript, rather than just playing it fast and loose and making all the hardcore programmers angry by being so sloppy (spoiler alert: they will still be angry). I won’t go into the boring details about how I generated the data. Let’s just have a look at the results; though, as always, all code and generated output will be attached.
Oh, but before we go on, if you thought Part 1 was interesting, you should go check out http://www.ohloh.net/p/rproject. Someone linked it in the comments of Part 1, and it’s definitely impressive. It has most of that information from that blog post and then some, and in a much cooler graph. From the drop down menu, select “Languages”. The graph is interactive, and if you (for instance) click on C (to hide it), then the graph rescales. Pretty cool!
Ok, so the results then.
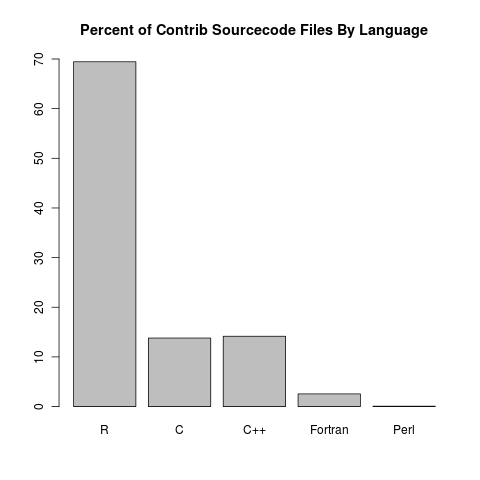
We will again first look at the Language breakdown of the number of total files:

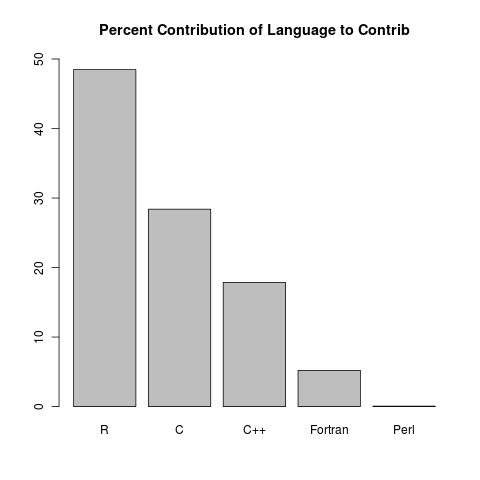
Here R is the clear victor by overwhelming majority. But the real challenge is looking at the language breakdown by percentage contribution to total lines of code (for our purposes here, we are looking at all ~3000 contributed packages and lumping them together as one huge mass of sourcecode). The following graph provides that, but first a word of caution. It’s a bit difficult to tell when a .h, or even a .c file is a C or C++ (in fact, you can fool the Unix/Linux tool “file” into believing these are all kinds of crazy things). As such, some choice had to be made (see the script if you’re interested). Errors likely occurred in determining what is C code and what is C++ code. That said, having made our choices, we have the following breakdown:

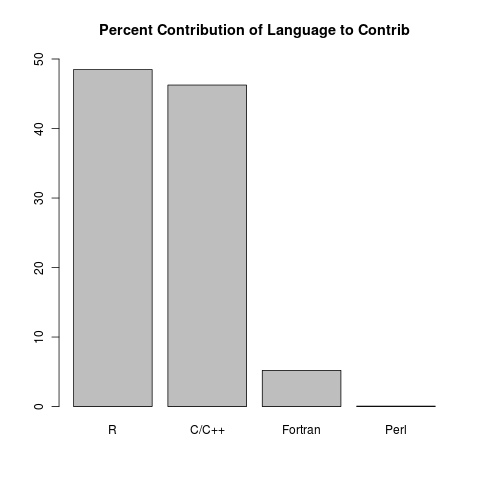
Here R is the clear victor, though in light of the doubt cast above, it is perhaps not as strong of a victory as we would hope. To assuage all doubt, we can lump C and C++ together into one category:

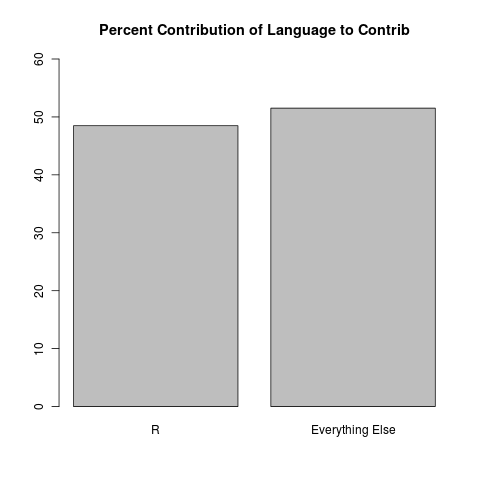
And look at that; R is still winning. Now, you probably see where this is headed:

Which is pretty darn good! In short, the people who are outside of the core R team but who are still developing incredibly cool things with R…are making those things in R. And why shouldn’t they? R rocks!
Here’s all the boring crap nobody cares about:
First, just a quick heads up; all the sourcecode to follow will look much better on my blog than on R-bloggers, because I have everything formatted (with highlighted syntax) specially in Wordpress. So if you want to be able to read this, then I would recommend reading it directly from my blog.
The shell script to grab all the packages and generate the “csv” (output is tab delimited (because some screwey files have commas in them), changed to .xls because wordpress hates freedom, split into two pieces because xls is a dumb format: piece 1 piece 2):
#!/bin/sh

outdir="wherever/"

wget -e robots=off -r -l1 --no-parent -A.tar.gz http://cran.r-project.org/src/contrib/

srcdir="cran.r-project.org/src/contrib"
cd $srcdir

echo -e "nn          This will take a LONG FREAKING TIME.n          Please wait paitently.nn"

touch $outdir/r_contrib_loc_by_lang.csv

#echo "Language,File.Name,loc,Proj.Name,Proj.ID.Nmbr" >> $outdir/r_contrib_loc_by_lang.csv
echo -e "LanguagetFile.NametloctProj.Name" >> $outdir/r_contrib_loc_by_lang.csv

for archive in `ls *.tar.gz`;do
  tar -zxf $archive
done

for found in `find . -name *.r -or -name *.R -or -name *.pl -or -name *.c -or -name *.C -or -name *.cpp -or -name *.cc -or -name *.h -or -name *.hpp -or -name *.f`; do
  loc=`wc -l $found | awk '{ print $1 }'`
  filename=`echo $found | sed -n 's:^(.*/)([^/]*$):2:p'`
  proj=`echo $found | sed -e 's/.///' -e 's//.*//'`
  lang=`echo $filename | sed 's/.*[.]//'`

  if [ $lang = "r" ]; then
    lang="R"
  elif [ $lang = "pl" ]; then
    lang="Perl"
  elif [ $lang = "C" ]; then
    lang="c"
  elif [ $lang = "cpp" ]; then
    lang="c++"
  elif [ $lang = "h" ]; then
    lang="c"
  elif [ $lang = "hpp" ]; then
    lang="c++"
  elif [ $lang = "f" ]; then
    lang="Fortran"
  elif [ $lang = "cc" ]; then
    # Use file for best guess; bad guesses we revert to c
    lang=`file $found | awk '{ print $3 }'`
    if [ $lang = "English" ] || [ $lang = "Unicode" ]; then
      lang="c"
    fi
  fi

  echo -e "$langt$filenamet$loct$proj"  >> $outdir/r_contrib_loc_by_lang.csv
done

echo -e "\n\n          ALL DONE\n\n"
And here’s the R script used to analyze everything and generate the barplots:
r.loc <- read.delim("r_contrib_loc_by_lang.csv", header=TRUE, stringsAsFactors=FALSE)

a <- r.loc[which(r.loc[1] == "R"), ][3]
b <- r.loc[which(r.loc[1] == "c"), ][3]
c <- r.loc[which(r.loc[1] == "c++"), ][3]
d <- r.loc[which(r.loc[1] == "Fortran"), ][3]
e <- r.loc[which(r.loc[1] == "Perl"), ][3]

lena <- length(a[, 1])
lenb <- length(b[, 1])
lenc <- length(c[, 1])
lend <- length(d[, 1])
lene <- length(e[, 1])

files.total <- lena + lenb + lenc + lend + lene
loc.total <- sum(a) + sum(b) + sum(c) + sum(d) + sum(e)

cat(sprintf("nNumber R files:ttt %dnNumber C files:ttt %dnNumber C++ files:tt %dnNumber Fortran files:tt %dnNumber Perl files:tt %dn", lena, lenb, lenc, lend, lene))
cat(sprintf("--------------------------------------"))
cat(sprintf("nTotal source files examined:t %dnn", files.total))

cat(sprintf("nLines R code:tt %dnLines C code:tt %dnLines C++ code:tt %dnLines Fortran code:t %dnLines Perl code:t %dn", sum(a), sum(b), sum(c), sum(d), sum(e)))
cat(sprintf("--------------------------------"))
cat(sprintf("nTotal lines of code:t %dnn", loc.total))

cat(sprintf("%% code in R:tt %fn%% code in C:tt %fn%% code in C++:tt %fn%% code in Fortran:t %fn%% code in Perl:tt %fn", 100*sum(a)/loc.total, 100*sum(b)/loc.total, 100*sum(c)/loc.total, 100*sum(d)/loc.total, 100*sum(e)/loc.total))

png("1_pct_contrib_source_files.png")
barplot(c(100*lena/files.total, 100*lenb/files.total, 100*lenc/files.total, 100*lend/files.total, 100*lene/files.total), main="Percent of Contrib Sourcecode Files By Language", names.arg=c("R","C","C++","Fortran","Perl"), ylim=c(0,70))
dev.off()

png("2_pct_contrib_code.png")
barplot(c(100*sum(a)/loc.total, 100*sum(b)/loc.total, 100*sum(c)/loc.total, 100*sum(d)/loc.total, 100*sum(e)/loc.total), main="Percent Contribution of Language to Contrib", names.arg=c("R","C","C++","Fortran","Perl"), ylim=c(0,50))
dev.off()

png("3_pct_contrib_code_c.cpp.combined.png")
barplot(c(100*sum(a)/loc.total, 100*(sum(b)+sum(c))/loc.total, 100*sum(d)/loc.total, 100*sum(e)/loc.total), main="Percent Contribution of Language to Contrib", names.arg=c("R","C/C++","Fortran","Perl"), ylim=c(0,50))
dev.off()

png("4_pct_contrib_code_r.vs.all.png")
barplot(c(100*sum(a)/loc.total, 100*(sum(b)+sum(c)+sum(d)+sum(e))/loc.total), main="Percent Contribution of Language to Contrib", names.arg=c("R","Everything Else"), ylim=c(0,60))
dev.off()
With output:
Number R files:          46054
Number C files:          9149
Number C++ files:        9387
Number Fortran files:        1684
Number Perl files:       44
--------------------------------------
Total source files examined:     66318

Lines R code:        6009966
Lines C code:        3519637
Lines C++ code:      2214267
Lines Fortran code:  645226
Lines Perl code:     6910
--------------------------------
Total lines of code:     12396006

% code in R:         48.483084
% code in C:         28.393315
% code in C++:       17.862745
% code in Fortran:   5.205112
% code in Perl:      0.055744